
Remote identity validation technologies enable people to assert their identity online, without going to a physical location. It is important to understand the performance of these systems and the degree to which they may reduce fraud while maintaining access to services.
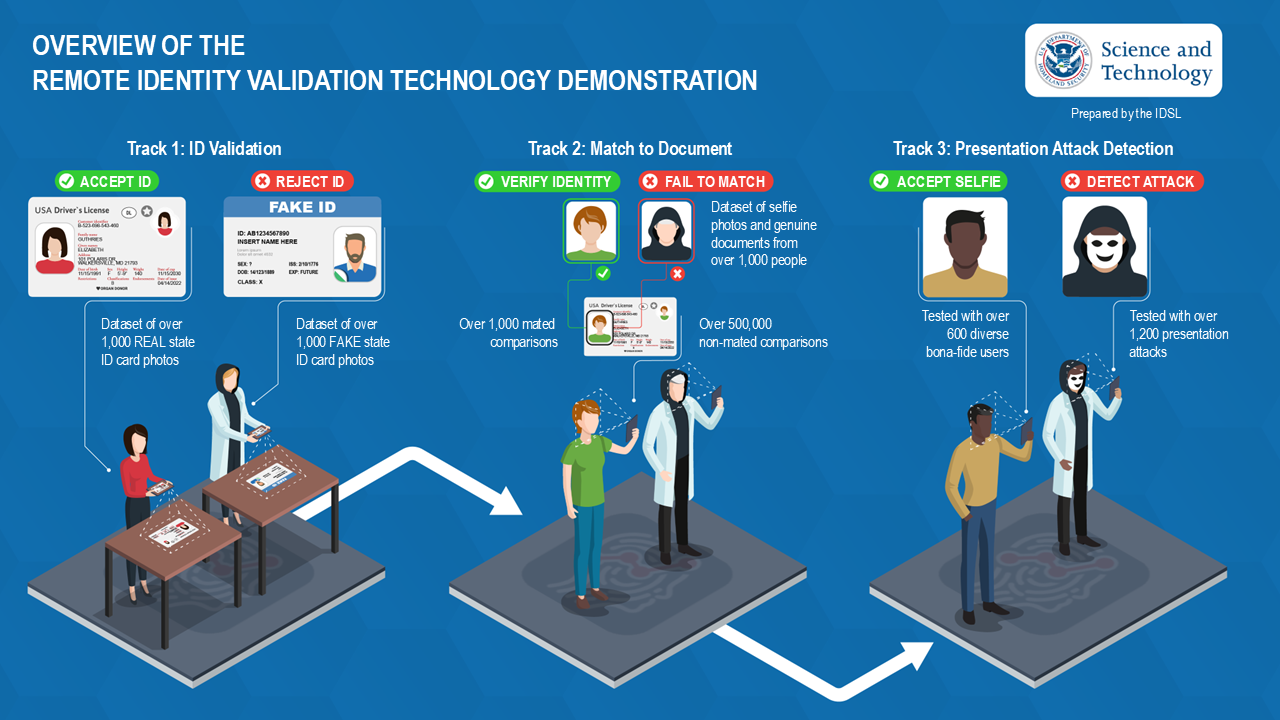
The Remote Identity Validation Technology Demonstration (RIVTD) challenged industry to demonstrate secure and accurate remote identity validation technologies that can combat identity fraud when users apply for government services, open bank accounts, or verify social media accounts.
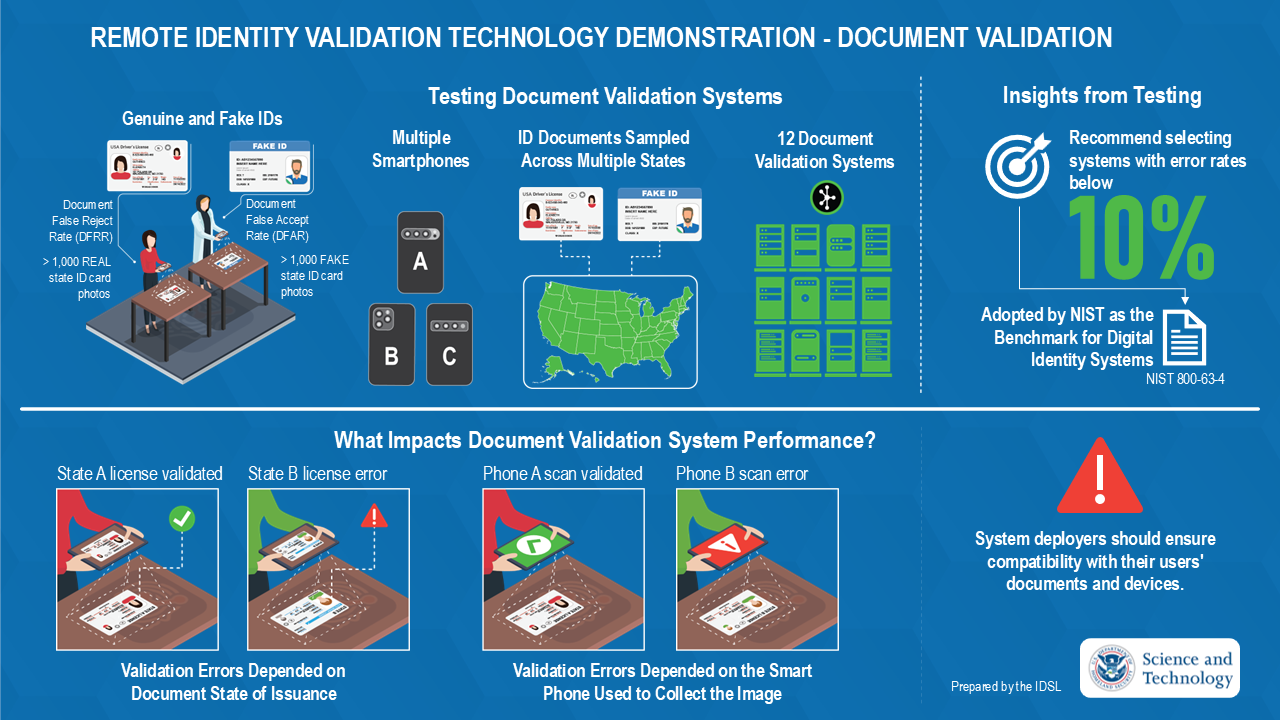
The RIVTD was divided into three tracks, for three different steps in the remote identity validation process. The first track, document validation, tested systems that determine if an ID is genuine or not. The second track, match to document, tested systems that determine if a person in a selfie is the same person pictured on an ID document. The third track, presentation attack detection, tested subsystems that determine if a presentation is from a legitimate or fraudulent user, like someone using a mask to impersonate someone.
What is RIVTD
Document Validation Insights
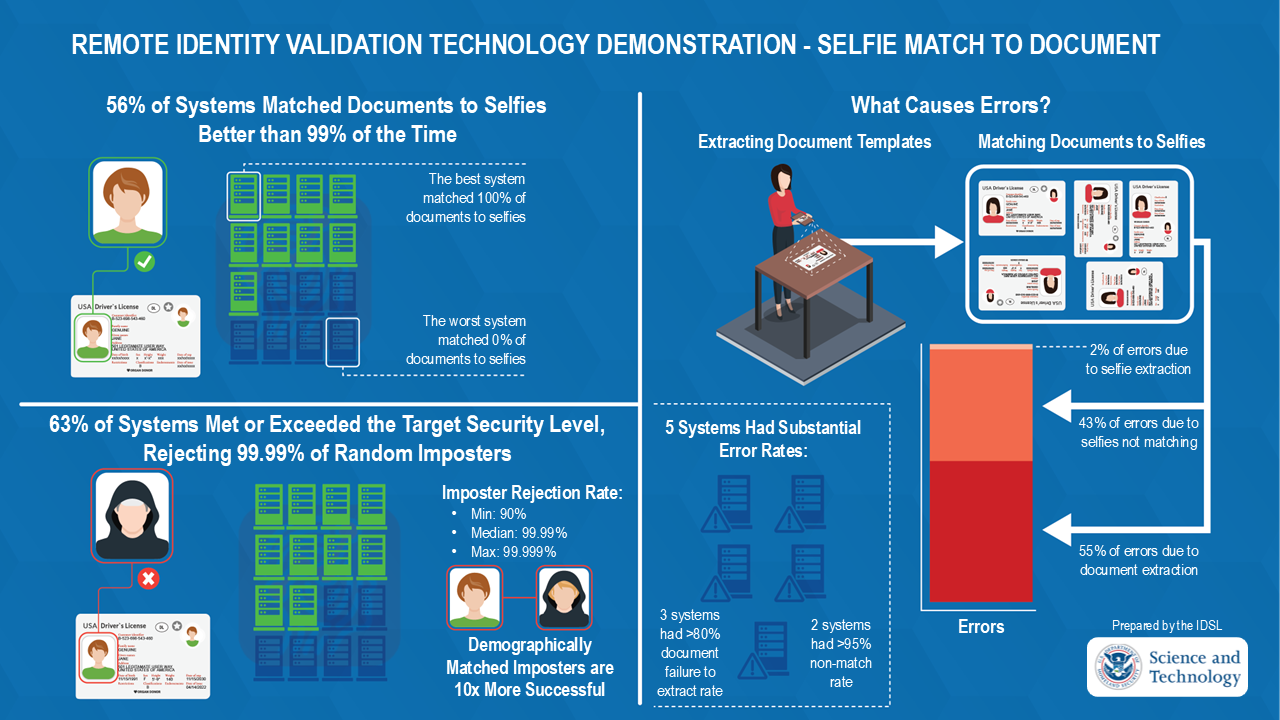
Selfie Match to Document Insights
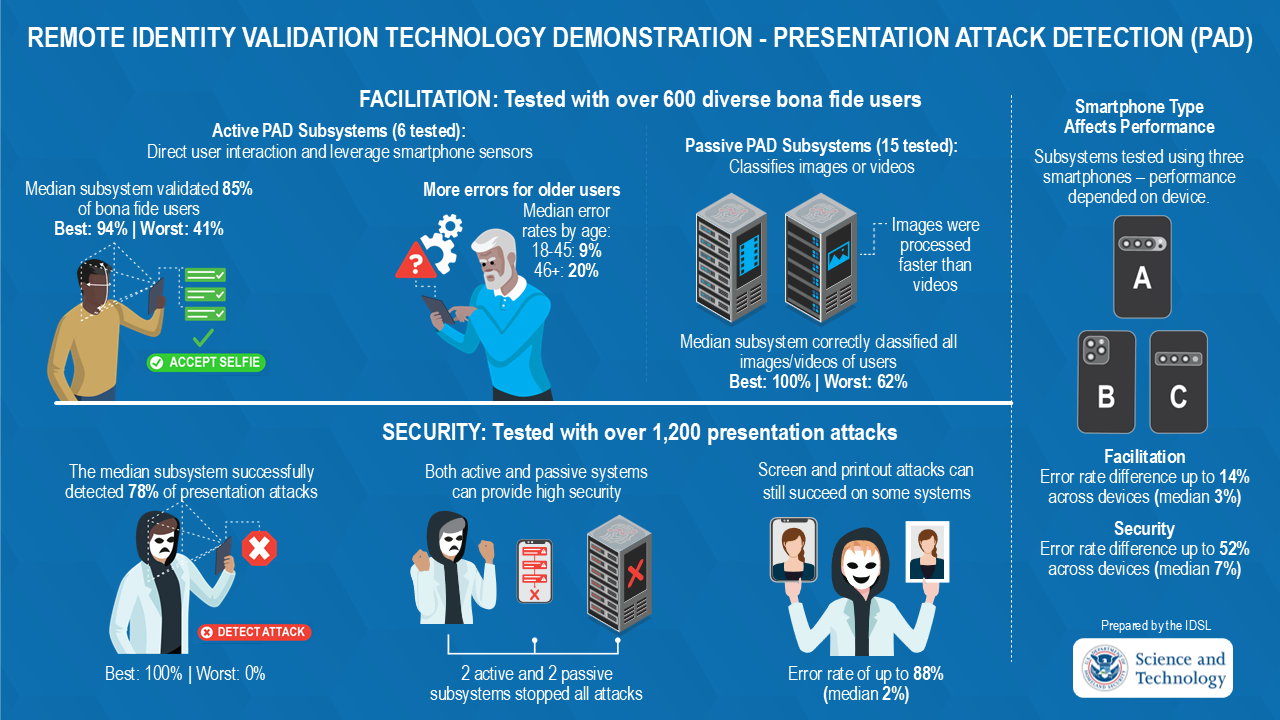
Presentation Attack Detection Insights
Selfie Match to Document Results
The Remote Identity Validation Technology Demonstration (RIVTD) demonstrated the current state of the industry when it comes to matching selfies to face images on identity documents. Match to Document Systems (MTDSs) processed selfie and document images from 1,633 paid volunteers, gathered in data collection events in Maryland and California.
MTDS performance was quantified by measuring failure to extract rates (FTXR) for selfie and document images (separately) and by false non-match rates (FNMR) between volunteers’ selfie and document images at thresholds supplied with each MDTS intended to achieve a false match rate (FMR) of 1:10,000.
Setting thresholds in biometric systems can be challenging. The thresholds provided with each MTDS were assessed by measuring FMR using a dataset of high-quality face images, gathered over a ten-year period at the Maryland Test Facility. The resulting FMR values were compared to the expected value of 1:10,000. Thresholds set too low (i.e. permissively) increase the likelihood of imposters matching someone else’s ID document. Thresholds set too high (i.e. conservatively) increase the likelihood that small changes in self-styling or facial appearance cause a person not to match their ID document.
The table below summarizes performance of each MTDS. Some systems had technical difficulties which meant that metrics could not be calculated. These are marked with “NA” in the table below.
| MTDS | 1 | 2 | 3 | 4 | 5 | 6 | 7 | 8 | 9 | 10 | 11 | 12 | 13 | 14 | 15 | 16 | |
|---|---|---|---|---|---|---|---|---|---|---|---|---|---|---|---|---|---|
|
|
Selfie FTXR |
0% | <1% | <1% | <1% | 0% | 0% | <2% | <9% | 0% | <1% | 0% | <1% | <1% | 0% | 0% | <1% |
|
|
Document FTXR | <100% | <80% | <3% | <1% | <1% | <1% | 0% | <13% | 0% | <17% | <6% | <2% | <100% | <13% | 0% | <2% |
|
|
FNMR | NA | NA | <1% | <1% | 0% | <1% | NA | <100% | <95% | 0% | <1% | <9% | NA | <1% | <1% | <1% |
|
|
Threshold Setting | P | P | C | C | C | E | NA | E | P | C | C | E | NA | E | P | E |
| Legend | |||||
|---|---|---|---|---|---|
| X | Met Benchmark | X | Did Not Meet Benchmark | X | Large Error |
| NA | Not Assessed | C | Conservative Threshold | P | Permissive Threshold |
The Remote Identity Validation Technology Demonstration (RIVTD): Face Liveness (API: Passive PAD System) demonstrated the current capabilities of industry solutions for detecting presentation attacks, which are malicious attempts to deceive identity verification systems using photos, videos, masks, or other instruments. As part of the demonstration, presentation attack detection (PAD) subsystems were tasked with detecting presentation attacks without sacrificing user convenience for a diverse group of 660 people.
Two types of PAD subsystems were demonstrated: active and passive. Active subsystems allowed for direct user interaction, while passive subsystems processed images or videos captured beforehand.
Effectiveness was evaluated using two key metrics: Bona Fide Presentation Classification Error Rate (BPCER) and Attack Presentation Classification Error Rate (APCER). BPCER measures the proportion of legitimate uses incorrectly flagged as attacks, while APCER measures the proportion of attacks misclassified as legitimate users.
The RIVTD Face Liveness (API: Passive PAD System) demonstration used multiple smartphones and various attack species. To represent the worst-case performance scenario for each subsystem tested, the metrics for effectiveness, efficiency, and satisfaction in the table reflect the maximum (max) or minimum (min) value recorded across all smartphones and attack species.
Active PAD Results
For active subsystems, Efficiency was measured as the average time users spent interacting with the PAD subsystem (Average Transaction Time). Satisfaction was measured as the proportion of positive responses after interacting with the subsystem.
| PAD-A | 1 | 2 | 3 | 4 | 5 | 6 |
|---|---|---|---|---|---|---|
| BPCER (Max) | 12.9% | 58.6% | 17.0% | 11.4% | 41.5% | 6.1% |
| APCER (Max) | 0.0% | 6.7% | 0.0% | 36.7% | 31.7% | 23.3% |
| Satisfaction (Min) | 91% | 77% | 78% | 87% | 70% | 89% |
| Average Transaction Time (Max) | 28s | 40s | 33s | 27s | 34s | 32s |
| Legend | |||
|---|---|---|---|
| X | Met Benchmark | X | Did Not Meet Benchmark |
Passive PAD Results
As passive subsystems had no direct interaction with the volunteers, Efficiency was measured as the average time needed to process a face image or video (Average Run Time).
| PAD-P | 1 | 2 | 3 | 4 | 5 | 6 | 7 | 8 | 9 | 10 | 11 | 12 | 13 | 14 | 15 |
|---|---|---|---|---|---|---|---|---|---|---|---|---|---|---|---|
| BPCER (Max) | 16.0% | 38.0% | 0.5% | 0.5% | 0.3% | 14.7% | 0.0% | 0.3% | 8.5% | 0.0% | 2.1% | 0.2% | 0.2% | 14.5% | 31.9% |
| APCER (Max) | 0.0% | 21.7% | 35.0% | 96.7% | 46.7% | 3.3% | 18.3% | 3.3% | 0.0% | 98.3% | 96.7% | 100.0% | 38.3% | 5.0% | 21.7% |
| Average Run Time (Max) | 3s | 1s | 4s | <1s | <1s | <1s | 2s | <1s | 1s | 2s | 1s | 22s | 19s | 28s | 10s |
| Legend | |||
|---|---|---|---|
| X | Met Benchmark | X | Did Not Meet Benchmark |